Pulse, analytics dashboard
A sales dashboard with light and dark themes, sortable tables, CSV export and hand-built charts.
Context
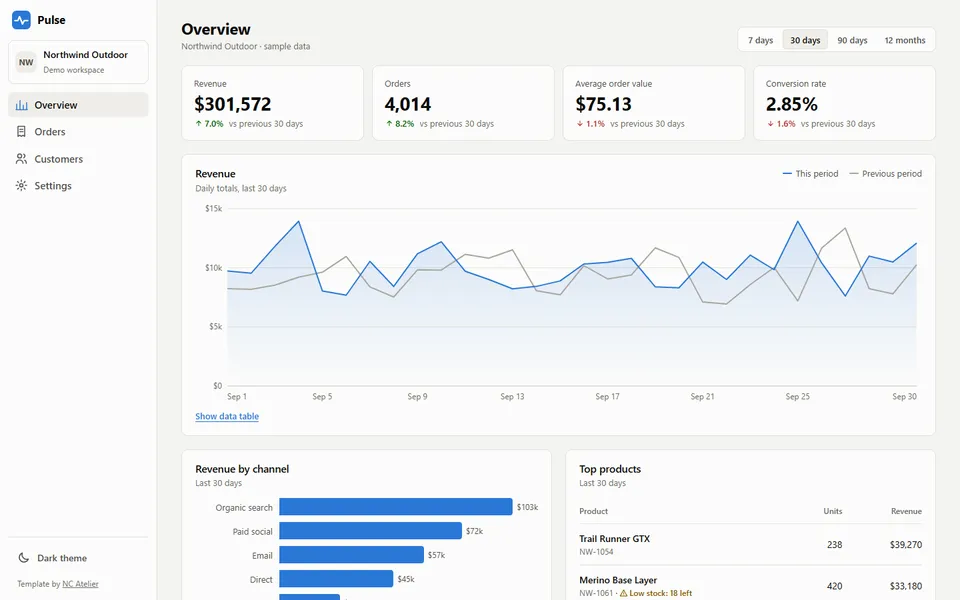
Pulse shows the sales of “Northwind Outdoor”, a fictional store. Orders and figures are generated from a fixed seed. The business is fictional: names, prices, reviews and figures are demo content. The code is complete and deployable.
The challenge
Make numbers readable at a glance, for everyone, without loading a chart library.
What I did
- Overview: date presets, KPIs compared with the previous period, revenue, sales by channel, top products.
- Orders: search, status filters, sorting, pagination and CSV export of the filtered rows.
- Hand-built SVG charts with legends, tooltips, colour-blind-safe colours and a data table for each one.
- Statuses shown with a colour, an icon and a label, never colour alone.
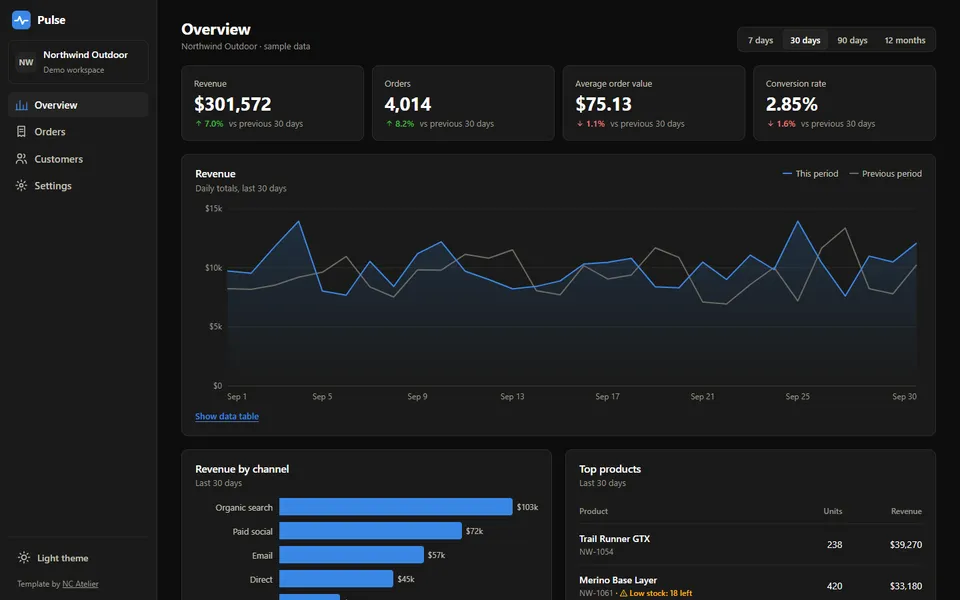
- Light or dark theme from the device, remembered, no flash on load.
Outcome
A static Nuxt site with no chart library. Swap the data file to connect it to a real API.
A similar project in mind?
Tell me about your project in a few lines. I reply personally, with questions or a first estimate.